

The voyage from Reykjavik and into the Mediterranean was anything but ordinary. After the stormy start, Statsraad Lehmkuhl sailed right into a marine heatwave.
The first two days of the voyage from Reykjavik to Nice were intense, with a strong storm and waves reaching nine meters high. Statsraad Lehmkuhl handles such conditions well, it was tougher for the scientists on board. Seasickness ran rampant. But as the saying goes: every cloud has a silver lining.
– It’s a fact - when the storm has passed, and the ship and crew are intact, everyone has come out of it stronger. And for those who do not work at sea and perhaps only experience such conditions once in their lives, it is an experience they will remember, wrote Jens Joachim Hiorth in the captain’s log on May 9.

Seven research stops
But the winds eased, and satellites high above captured clear images through the clear skies. The scientists got the conditions they had hoped for, and over the following ten days, seven research stops were carried out.

Statsraad Lehmkuhl heaved to: The sails were turned, breaking the ship to a full stop, and the rosette was lowered into the deep.
This instrument combines a CTD that measures conductivity, temperature and depth with tubes that open at different depths to collect water samples. Plankton samples were also taken, and 13 surface drifters deployed. The positions of these drifters are continuously transmitted back, revealing current patterns.
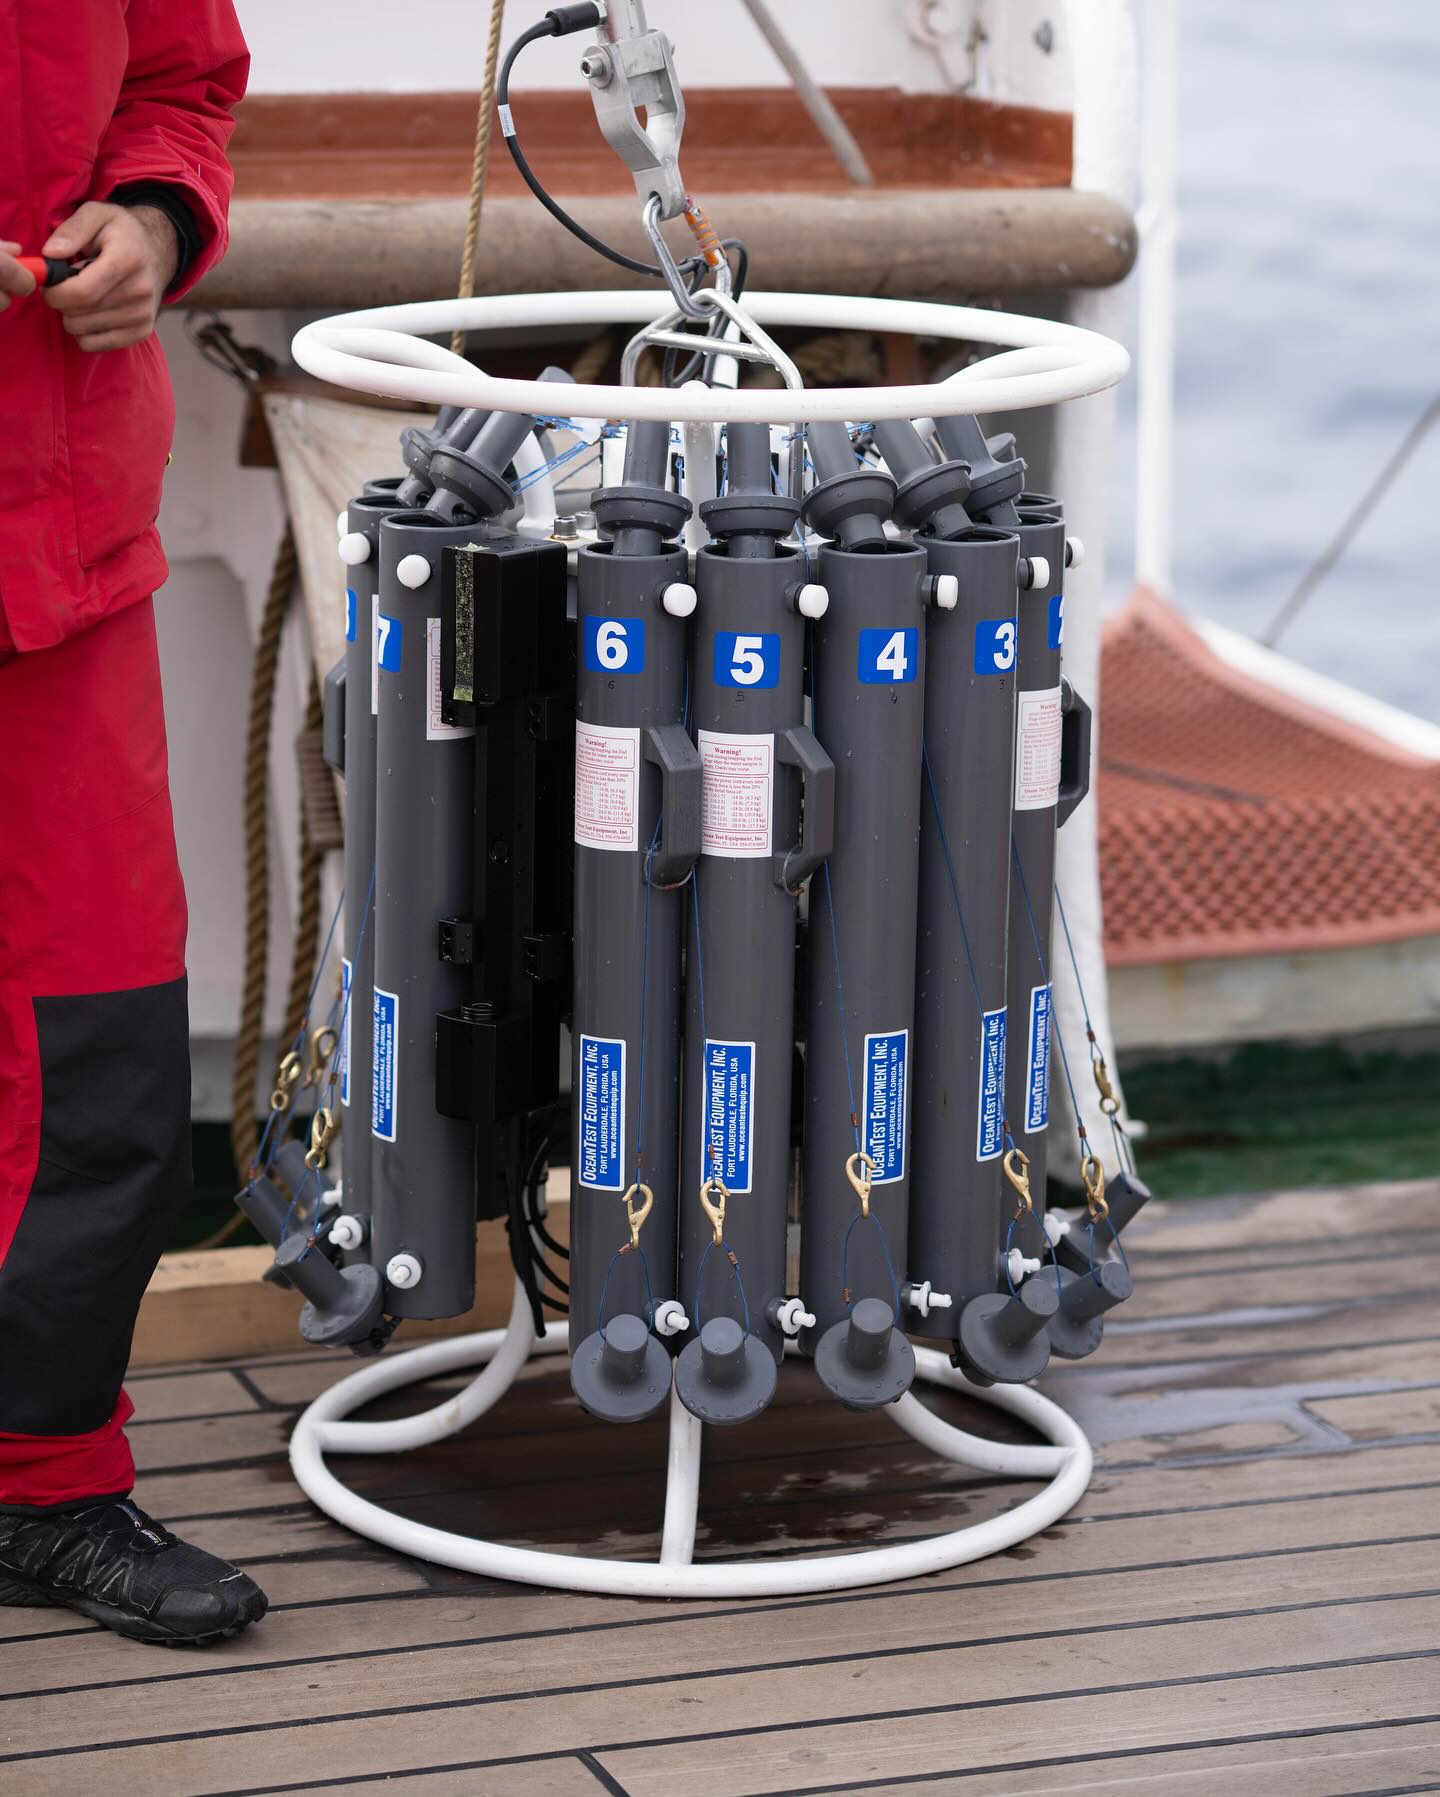
The rosette. Photo: Matteo Baratella
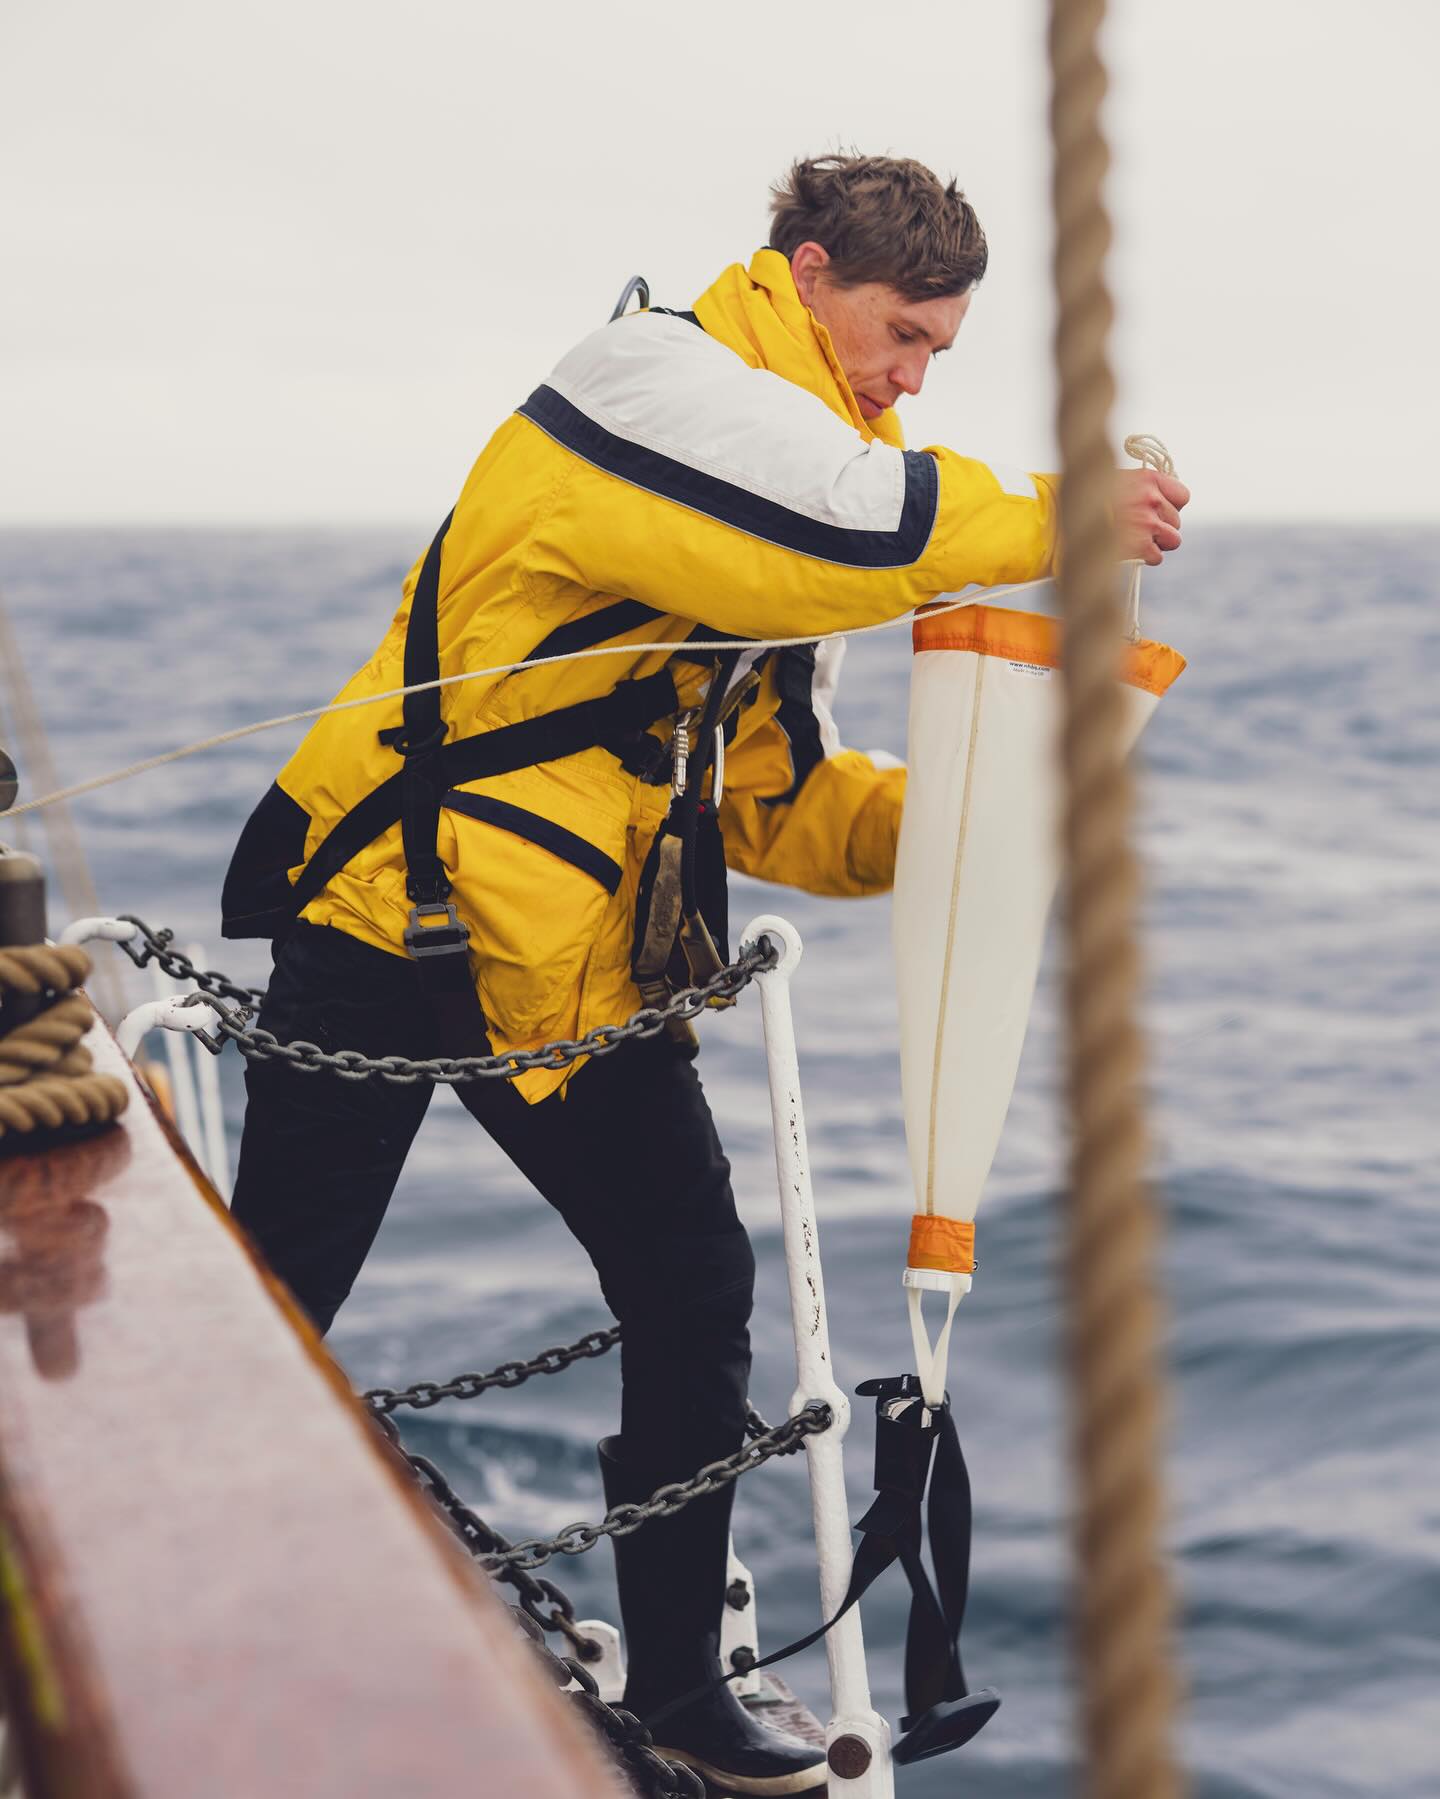
A plankton-net is deployed. Photo: Matteo Baratella

Happy with the catch! Photo: Matteo Baratella.
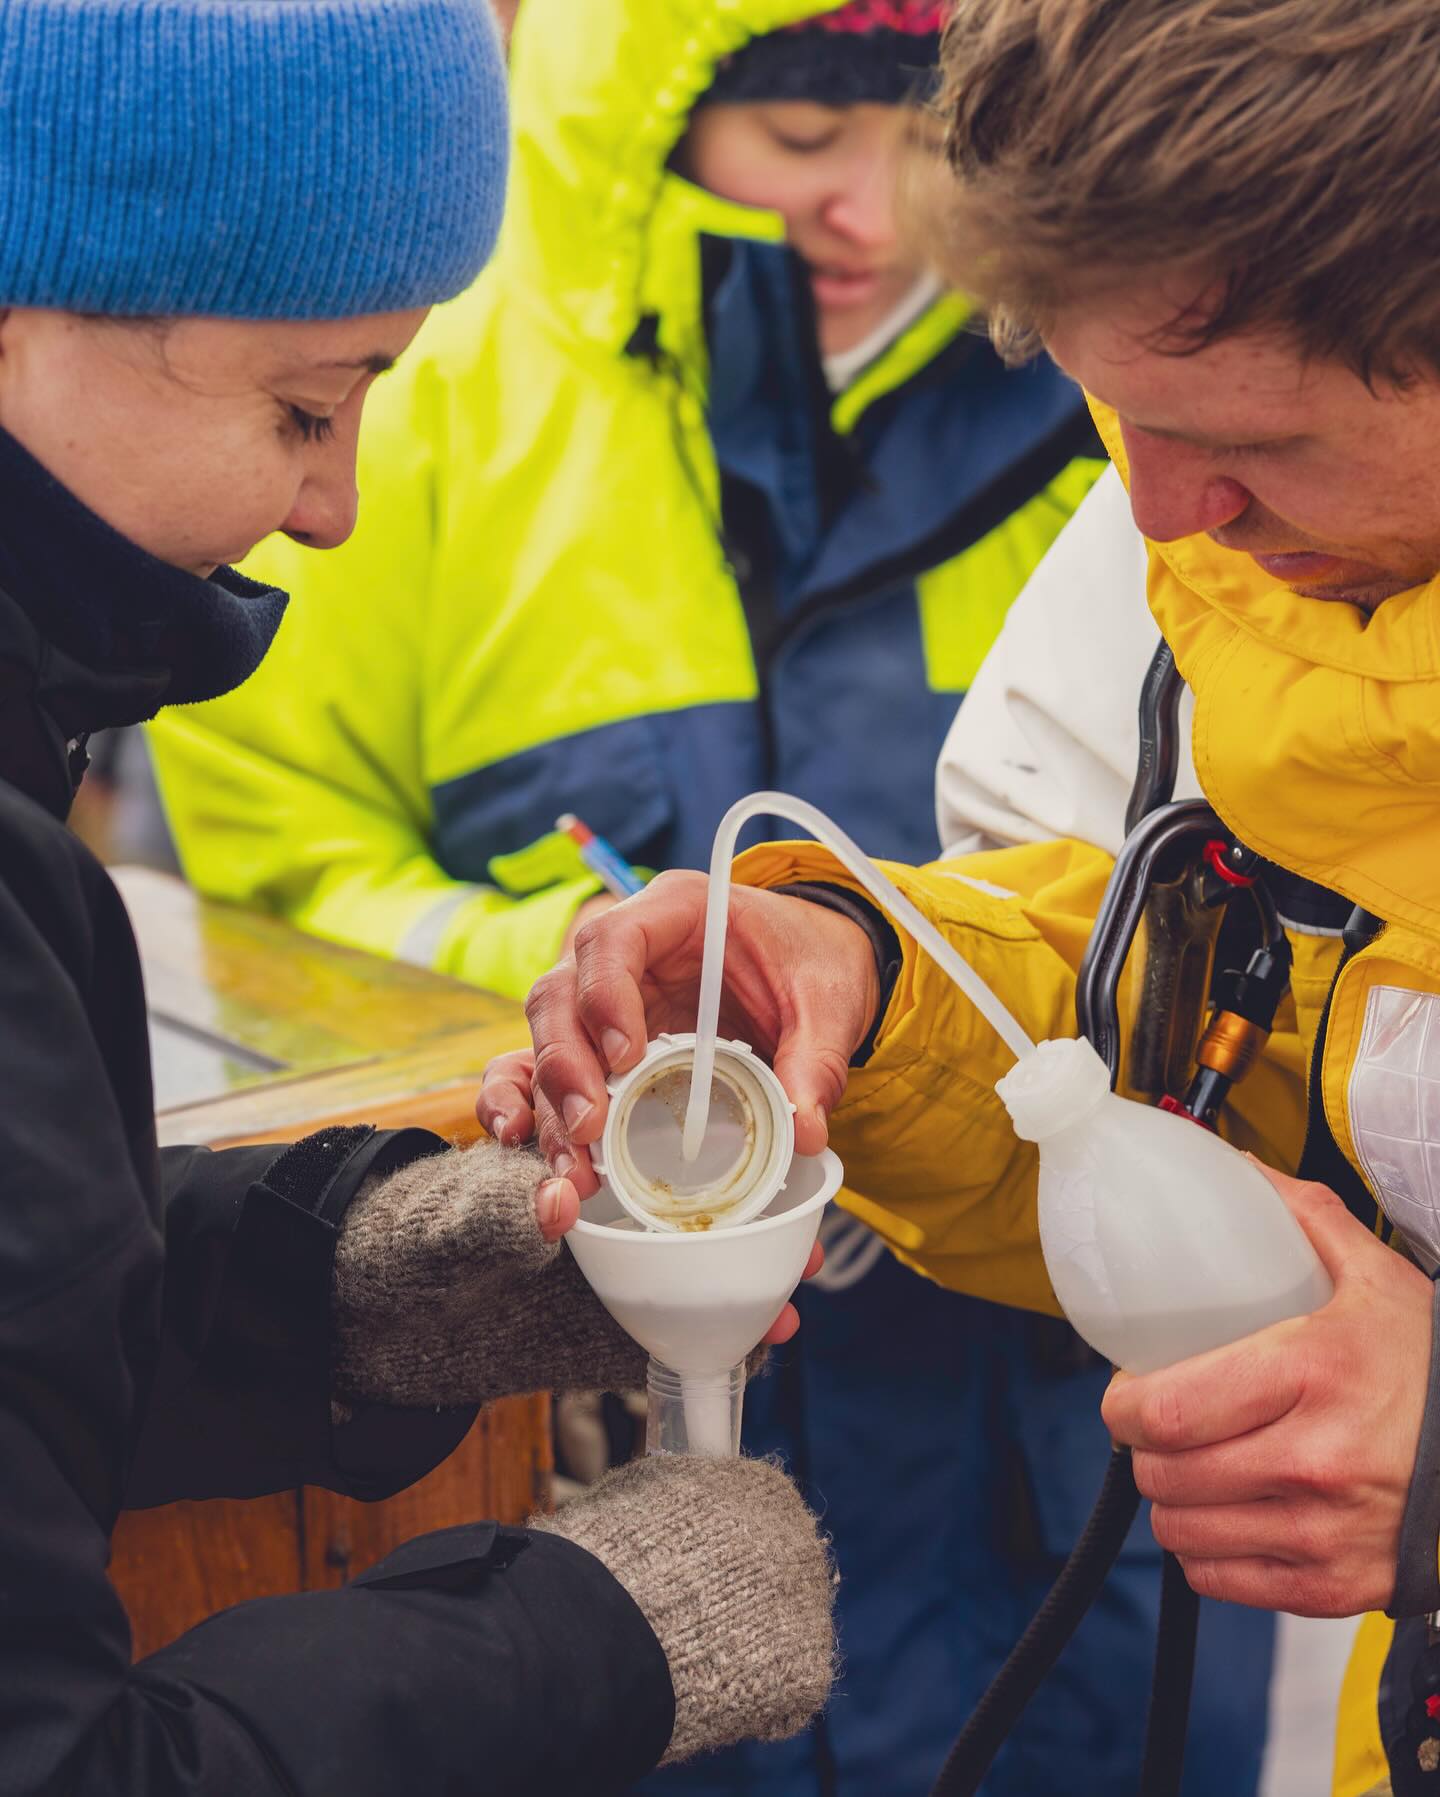
The contents is collected. Photo: Matteo Baratella
To compare
The purpose of these investigations is to compare what is actually happening in the ocean with what satellite images show. Did the scientists interpret the images correctly? They did.
– Real time analyses of the in-situ data continue to reveal very good co-variability with the collocated multi-sensor satellite data. The trajectory of the OMB surface drifter deployed on 15 Mai is shown in the picture below and suggests that it will become trapped in the small cyclonic eddy depicted in the ocean color data, wrote Johnny Johannessen from the Nansen Center in his report.

A marine heat wave
The storm near Iceland was unpleasant, but another type of “bad weather” concerned the scientists even more.
– Based on recent evidence from NOAA it appears that the ship track has taken us into and passed a region defined as a marine heat wave, Johannessen wrote.

A marine heatwave occurs when the surface temperature of the ocean stays unusually high, warmer than what’s typical for that time of year - for at least five consecutive days. It’s measured against sea temperatures from the past 30 years, and must fall within the warmest 10 percent for that period.
– Data collected during the passage of the marine heat wave show a distinct warm upper layer temperature of 14.5 C reaching down to about 20–30 m, thus further indicating the strength and volume of this heat wave, Johannessen wrote in his report.

More frequent
Marine heatwaves are not uncommon, but in recent years they have become both more frequent and more intense, especially in the Arctic. Global warming is heating the oceans, and less ice in the north means the sea absorbs more solar heat that would otherwise have been reflected. Shifts in ocean currents can also increase the likelihood of a heatwave forming.
– The impact of marine heat waves may be broad, Johannessen warns.
Life in the ocean has adapted to heatwaves, but the more frequent and longer they become, the greater the pressure. Fish and marine mammals may migrate to new areas, while organisms that cannot escape, like kelp forests and coral reefs, can die off in large numbers. We may also see more frequent harmful algal and bacterial blooms. Ocean temperatures influence the atmosphere above, and marine heatwaves increase the risk of extreme weather.
Alarming, yes - but being there and collecting data was extremely valuable for the researchers.
– Further analyses of the data collected during the passage of this heat wave might therefore provide more insight regarding these impacts, Johannessen concluded.